5 website search KPIs to improve your content strategy

Your website visitors expect to find precisely what they’re looking for — and fast. Does your website feature an effective search mechanism to uncover the most relevant content?
Visitors to your website have high expectations around the search experience: anything short of a Google-like search experience is going to lead to frustrated users and lost conversions.
Everybody has a search bar on their website now, but many companies follow a set-it-up-and-forget-about-it strategy and are not paying attention to what’s going on behind the ‘search curtain.’ They also don’t realize the impact that search can have on their content strategy.
Why you should fine-tune the user search experience
If you need convincing that search should not be ignored, here are a few stats that will challenge your content strategy:
Visitors that utilize your site’s search are 1.8 times more likely to convert.
Site visitors that leverage search account for up to 45% of revenue from your site.
Up to 30% will use onsite search when it is provided.
68% of visitors that have a negative search experience on your site will not return.
The good news is that it’s relatively easy to continuously fine-tune the user search experience if you know what you’re looking for and if you have easy access to the right search analytics.
Let’s look at what we consider the top 5 website search KPIs and see how you can use insights from these metrics to improve your content strategy.
1. Click-through rate (CTR)
The most well-known search metric, CTR, reveals how often visitors conduct a search and click on a result. Higher CTRs indicate relevant content and an overall optimized search experience.
Over time, you want your site’s CTR to trend upwards, an overall signal that search is improving and visitors are engaging with your content.
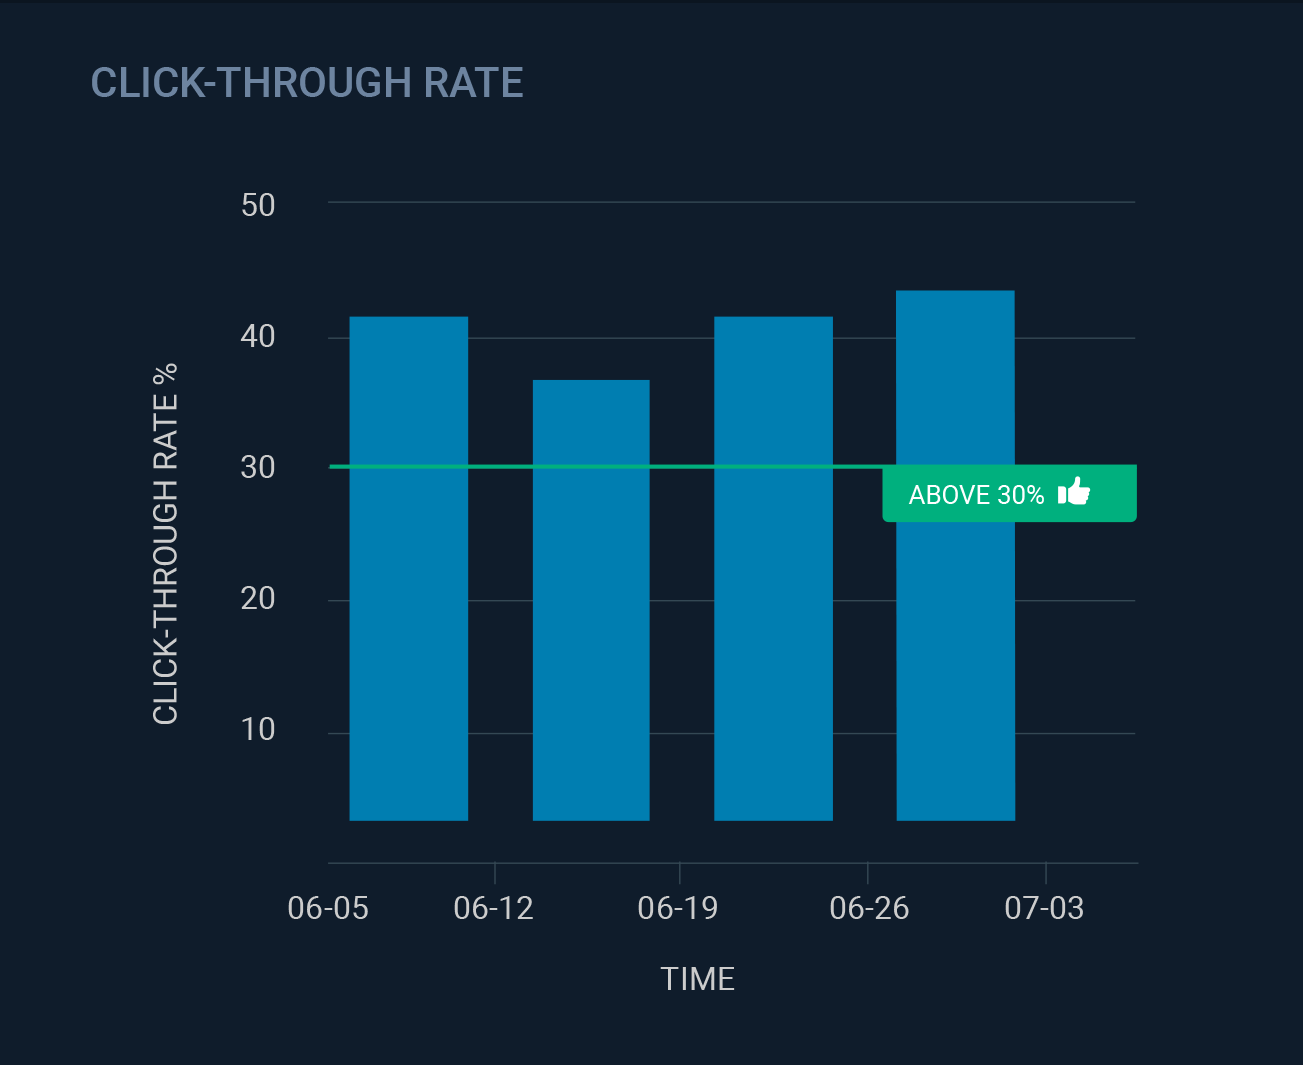
A great target for CTR is around 30%, but keep in mind what really counts is an upward trend. If your trend is downward, it’s where you end up, not where you start.

The dashboard in the website search platform from SearchStax reveals many metrics including click-through rate. In this example, onsite search is delivering acceptable CTRs above 30%.
2. No result searches
One of the worst experiences a visitor can have is to conduct a search which produces no results. Therefore, no result searches are a critical metric to monitor for your content team.
As your team gets in a rhythm for implementing search performance improvements, you should see no result searches trending downward over time, ideally reaching 3%.
Improving your no result searches KPI begins with understanding which searches are not returning any results. The best way to improve this KPI is to get a list of your no results searches and sort it in descending order based on search volume.
Then, you can make the process more manageable by starting with the top 10-15 searches that yield no results and use this information to modify your content strategy.
With this information, you then ask important questions:
Do no result searches indicate a gap in your content?
Do you need to create new content around particular no result searches?
Are your customers using an acronym or abbreviation to refer to content you don’t normally use?
Is there a common misspelling you haven’t accounted for?
3. Searches per session
A great indicator of onsite search relevance is the number of searches visitors are conducting per session.
If a user has to conduct multiple searches in a single session, your search has room for improvement. For each visitor that stays the course to conduct multiple searches, more visitors got frustrated and left the site.
The goal for average searches per session is to have a low number that trends downwards over time as your team leverages the metrics and implements improvements. Two or lower is considered great. Three or above is a clear sign there’s room for optimization.
4. Average click position
A great way to gauge the relevance of website search is to understand average click position — how deep in the results is the piece of content the user seeks.
Most search result pages include 10 results. If your average click position is 12, for example, you know that visitors must navigate to the second page of results, which is an area of opportunity to improve.
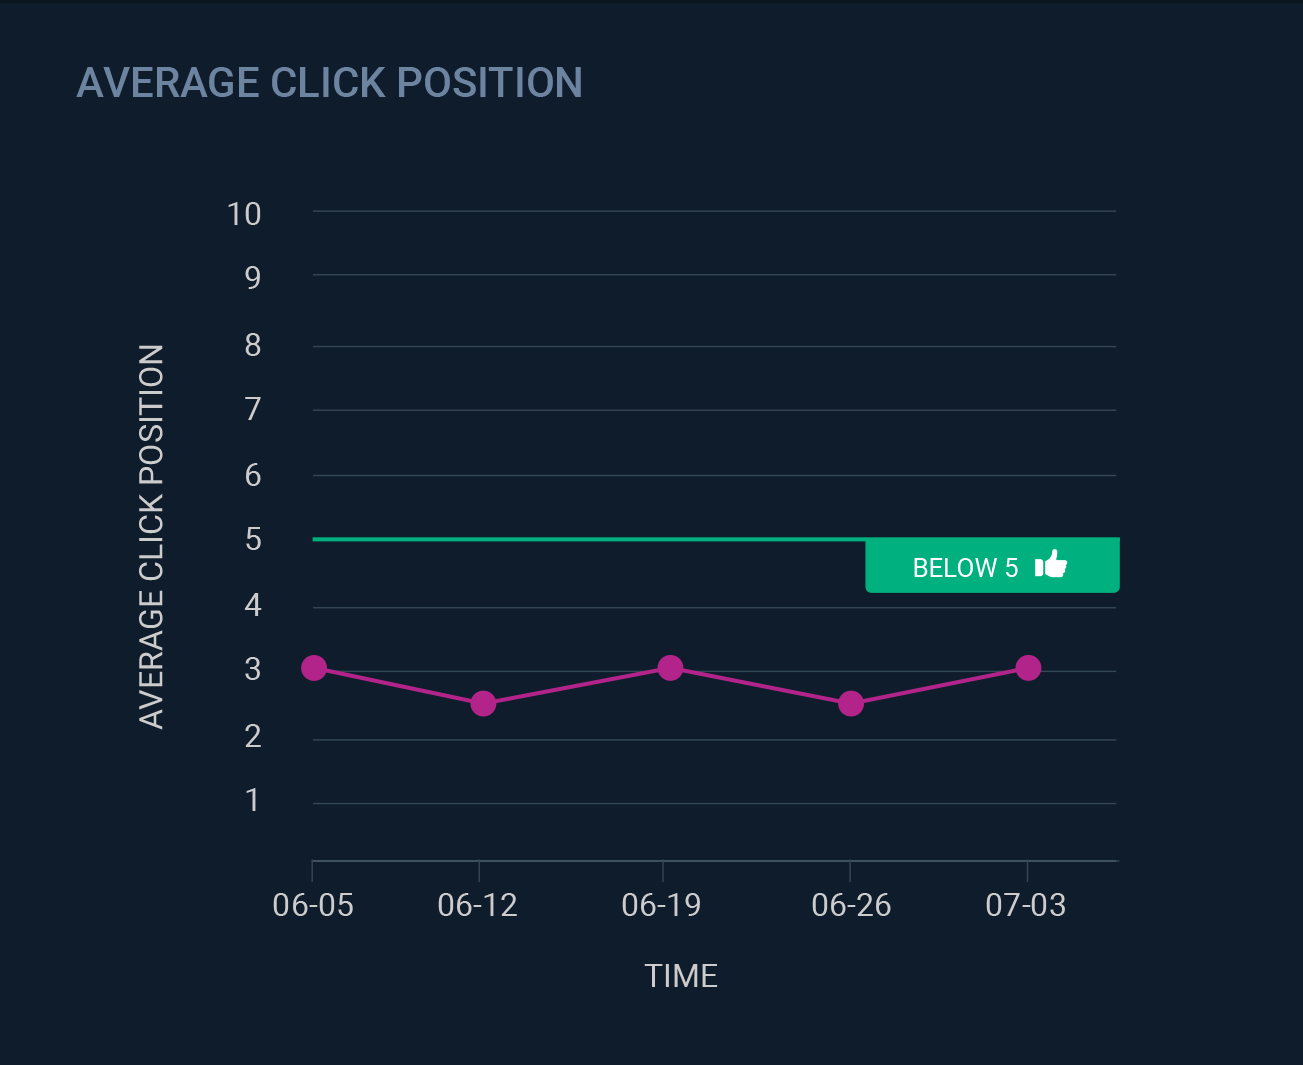
Over time, you want to see your site’s average click position trending downwards. A goal for this metric is to be at five or below, which indicates visitors are finding what they’re looking for in the top half-page of the search results

Data here from the dashboard reveals a very strong average click position hovering around 3.
5. Most clicked items
In order to be effective in their jobs, your content team needs to know what content is the most popular and what content is getting the most clicks. And the results are likely to surprise, or even disappoint you.
When you know what your most clicked items are, you can use search tools like Promotions or Rules to place your popular content at the top of relevant search queries to ensure that users can quickly get to the information they are seeking. The most clicked items can also give your content team insights for developing similar content.
Understanding website search is critical to improving your content strategy
When it comes to optimizing your content strategy, knowing what is happening with website search is critical.
The internal search KPIs we’ve reviewed deliver valuable indications of your website’s overall health and provide a roadmap for making adjustments. Armed with an understanding of onsite search performance, you will be able to make incremental improvements to deliver a better search experience for all users.
Looking for more guidance on your content strategy? This white paper covers the five value pillars for demonstrating the performance of composable architecture and technologies, with examples of KPIs and business outcomes to track their value.


